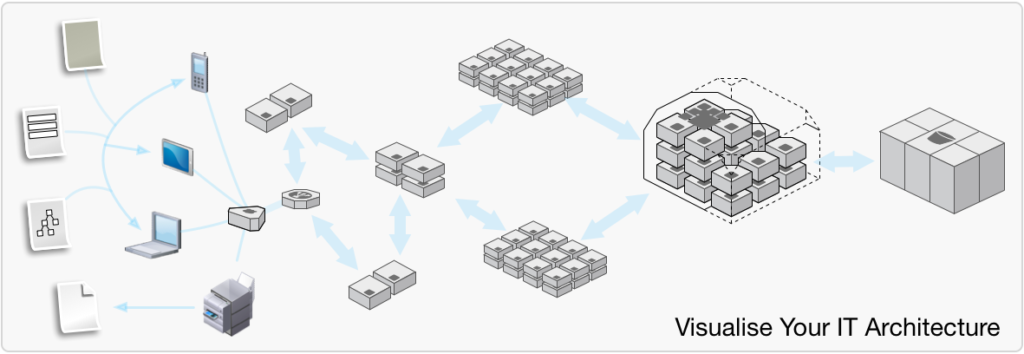
ChrisMundy.me

Hints and tips to stuff I've learnt and learning

You are here: Home / Archives for Visualising Information Technology

Visualize Your Architecture – 5 Tips for effective Tech Leads

June 24, 2015 By Chris Mundy Leave a Comment

Visualize Your Architecture – 5 Tips for effective Tech Leads. The inspiration for this article comes from this article by Patrick Kua from Thoughtworks.

Image of: Visualise Your Architecture
Patrick raises five great points about Tech leadership. I can affirm what he says as I’ve had the opportunity of leading some development teams in my career.

  1. Learn to Delegate
  2. Find Time to Code
  3. Visualise Your Architecture
  4. Spend Time 1-on-1 With Team Members
  5. Learn to Speak the Language of the Business

About Visualise your Architecture from the article, Patrick says … “I have worked in several teams where developers had no idea how their task fit into a bigger picture. A small technical decision made by a developer might have a wider architectural impact but impossible to prevent if developers to do understand the broader picture.

An effective Tech Lead often has a visual representation of their system architecture on-hand and uses it to have discussions with developers. There will often be different views of the architecture (logical, deployment, etc) and each diagram helps developers see how their task fits into a broader system architecture.

A whole-team whiteboard session is often a useful exercise for reviewing the overall architecture as it evolves over time to meet differing requirements and the discussion during the session is even more important than the diagram. Focus on key quality attributes that drive your architectural vision (scalability, performance, usability concerns, etc) and how they have shaped your architecture.

Call out assumptions and the historical context to help developers guide their everyday decisions.

Source: 5 Tips for Being an Effective Tech Lead | ThoughtWorks.

I want to focus on the ‘Visualise Your Architecture’ aspect as it is a key for any Technology Leader and ask these questions:

  • How do you easily show your team the big picture of your organisation, technology and interdependencies?
  • How do you show your director quickly and concisely what you’re building?
  • How can others get on same page quickly so they can understand what you’re doing and how you can help them?

My response to this is use more diagrams.

The challenge is changing the habits and here’s the choice:

“Do I write long documentation,

or

create more diagrams and lessen the amount of documentation?”

Less is more plus you get a higher-quality documentation.

Using Patrick’s 5 points, let me expand on those aspects to visualizations.

1. Learn to delegate the creation and management of diagrams or become the champion drawer yourself

If’ you’re on a software development project then someone in the team needs to create the visualizations such as the diagrams.

If’ the tech team haven’t got the skills, make sure you’ve got a business analyst on hand who understands tech people and can get down on paper what they are building and turn it into diagrams.

If you haven’t got anyone else, then you’re it!

As they say… “If it’s going to be its up to me”.

Everyone can draw, for some people it’s natural, others have to work at, you can be taught.

2. Find Time to Code

Ain’t that the truth. I had to work hard in University to pass my Java coding. I found more enjoyment in HTML and web development and still do a bit of HTML within the confines of the content management systems I specialise in.

Image of a Programming Language Cloud

I found by keeping my head and hands occasionally into HTML and CSS, it kind of keeps me sharp and it makes me remember things taught long ago.

Software coding is always changing. It pays to keep on top, it’s just like surfing, every wave is different, you just have to learn how to surf, do it often, so you know how to handle the different waves as they come along.

How do visualisations work with finding time to code??

A diagram acts as a mental cue to help remember how to write software code.

Pull out the diagram and start going over the code and you’ll quickly start to get your head around things.

By the way, does your organisation have technology coding diagrams and standards?

That’s a question that the next pay grade up from you needs to answer if they don’t have any.

3. Visualise Your Architecture

Some years ago, I did a five-day intense Enterprise Architecture course. Besides coming out of that course feeling like I stepped out in front of a moving bus and getting slammed, I had several days if not months to digest the information and start applying it. I still refer to workbooks today.

I came into Enterprise Architecture with a bent on drawing it.

When I started creating architecture diagrams and posters, I was initially really drawing for myself, I was teaching myself how the complete Enterprise Architecture hung together where I worked.

The crazy thing was that others could also understand it as well. Comments like, “now I get it”, “I didn’t know that connected to that”, or, “that’s a bad design we need to focus on that area” and “this is first time I’ve seen the whole Technology picture.”

The visualizations created a platform for a conversation, and one that was a focused conversation on the subject and not someone’s point of view, it standardised viewing and understanding.

Where to put the architecture visualization posters

When you create architecture visualization posters, put them in strategic places around the office, up on the wall at eye level to the situation; sitting or standing. Make them big, so people can see and read them.

Strategic places around the office are:

  • Near the lift
  • Near the water cooler
  • In the tea room
  • At the entrance to the director’s office
Image of Wall E Poster: Visualise Your Architecture

Amazing what a Poster can do, Hollywood has been doing it for some time. It must work!

If you create architecture visualization diagrams and posters, make sure they make sense, are correct and look smart, if they don’t, they quickly become re-cycling paper.

4. Spend Time 1-on-1 With Team Members

Looking back to my days of project managing a software development team, I learnt lots. I put into practice my motto I held for years for being a student of better things.

“It’s better to ask dumb questions than make stupid mistakes”.

I’m that guy who learnt the hard way. I had this incredible team of smart young developers who have since gone on to areas of Technology Leadership in the Public Sector. The best way I learnt off this talent was drawing the technical diagrams they needed for their software development and system integration. I would ask them one-on-one questions such as, does, this look right? Is there anything else to add?

They rolled their eyes, muttered under their breaths and helped me with my technical diagrams, then got back to writing code. Between the group, they managed to write a software messaging server for a high-performance, high-capacity, and high-volume data management solution.

1-on-1 in the professional setting is great. The things I’ve learnt as a tech lead from these relationships are:

  • People have other points of view, especially in technology,  you can always learn something new,
  • Challenge people to go to the next level in whatever they do, stretching the mind helps people to grow and discover new horizons, especially in technology,
  • Respect the people’s differences and work with them, whatever their differences, your role is to help them excel at their job. Have you thought they might not like your differences??

5. Learn to Speak the Language of the Business: Use visualizations

One of the key ways to speak the language of the business is to use visualizations such as diagrams. Some of the key diagrams for this are:

  • Organisation charts
  • Operating models
  • Product description diagrams
  • Business process diagrams
  • Use case diagrams

Without going into each of these types of diagrams, these represent key activities of the business and customer or client interactions.

In each of these diagrams, there is an opportunity to incorporate the language of the business. The benefits of using the language in the diagram is two-fold:

  • People get to paint a mental image of what the activity is and what it does,
  • People are reminded of the correct business language and terminology, descriptions and the semantics of the business language.

In closing, as a Tech Lead, do not underestimate the value of a diagram and the power it has to convey a message to give a better outcome.

Get your people using more diagrams and it will improve the quality of your products and improve the ability for you to communicate with others.

Well, it’s time to get drawing, get to it!

Visualization Techniques: Making A Difference

June 11, 2015 By Chris Mundy Leave a Comment

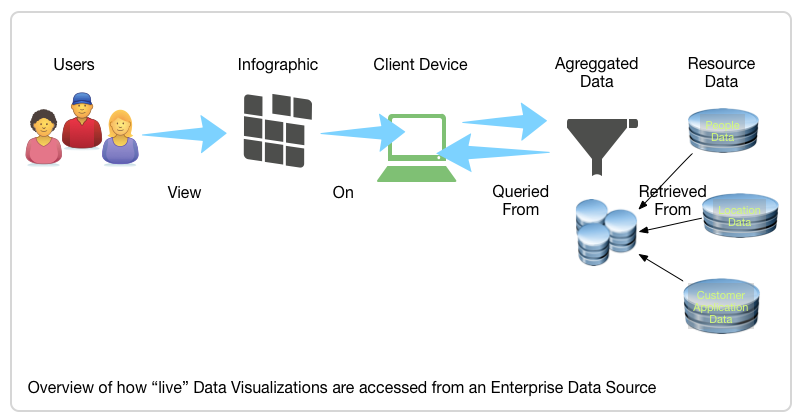
In this blog post I will look at Visualization techniques that have made and are making a difference along with changing how we do things. Let’s start with a couple of stories from history and see how visualization techniques impacted major decisions.

Visualizing data helped the Allies during World War 2

Some years ago, I walked into Churchill’s War Rooms in London. My interest in visiting the war rooms came from my mother who grew up in the UK during World War 2. Mum survived the blitz in Portsmouth, home of the Royal Navy.

The closest call for Mum came on the 10th January 1941 when a bomb fell on the house next door, thankfully the Anderson Air Raid shelter protected the family from the flying debris.

Back at the war rooms, besides the amazement of the time capsule of the war rooms itself, I was surprised to see that Data Visualizations were alive and well and were used by Winston Churchill and the war cabinet in the 1940s.

There on the wall in all its glory were graphs and charts, describing units, manpower, enemy sizes, casualties and more.

Although not found in the War Rooms, this chart is an example of a Visualization of the period. It's the Chart of merchant shipping losses, 1939-41. Reference: MacDougall Papers, MACD 28/4. Courtesy of Churchill's scientists 13th April 2015 in Archives Centre, Art & Exhibitions - Churchill Cambridge College
Although not found in the War Rooms, this chart is an example of a Visualization of the period. It’s the Chart of merchant shipping losses, 1939-41. Reference: MacDougall Papers, MACD 28/4. Courtesy of Churchill’s scientists 13th April 2015 in Archives Centre, Art & Exhibitions – Churchill Cambridge College

The information provided two valuable pieces of the jigsaw puzzle of war:

1. You could comprehend what was happening
2. You could make better decisions based on that information

One of the key underpinning successes of the war came from the collection of information and the ability to assess it and act upon it so. The visualizing technique helped comprehend information quickly.

Visualizing process information changed how we manufacture things today

Since World War 2 data visualizations such as graphs and charts have been dominant in shaping how we do things. Industry has benefited greatly from it.

As an example, Just-in-time (JIT) manufacturing, a method aimed primarily at reducing flow times within production, provided key information for improving response times from suppliers and to customers.

JIT reduces time across production and delivery along with removal of wastage and rework, keeping just the right amount of stock to meet demand.

Image of a Just in Time Stock Visualization for Visualizing Techniques

From its origin and development in Japan in the 1960s and 1970s. Western industry saw the value it provided and eventually it migrated to the west in the 1980s.

When people saw the charts and graphs, the data visualizations that showed what it improved, it was only a matter of time before it was adopted.

With the advent of the mainframe and personal computers, programs such as Batch spreadsheet report generator, IBM Financial Planning and Control System, VisiCalc, Lotus 1-2-3, Microsoft Excel allowed a person to take data, put into the spreadsheet and represent it graphically.

Infographics help us to Visualize Big Data

Since the 60s we’ve been storing lots of data. As we’ve gotten more proficient with tape and disk storage, we’ve stored more and more data. We’ve gotten to point of having mobile data centres in a container. All this data wherever its stored and access is better known as Big data. Big data is a rather broad term for larger data sets.

Social Network Analysis Visualization

It was only a matter of time when technology provided the ability to look at data warehouses and the big data it stored then ask, “how can I display and use this information in a meaningful way?”

So the modern data visualization was born.

One of the main goals of Visualizing big data is to communicate information clearly and effectively through graphical means.

Now, to make it more interesting, let’s put this criteria on how we should deal with this big data and make it graphical:

• Make it functional – let the data tell the story
• Make it interesting to look at (aesthetics)
• Make it easy to read (intuitive)

So putting that into a formula we come up with this:

Functionality + Aesthetics + Intuitive = Infographic

Thus the Infographic was born: a graphical visual representation of information, intended to present information quickly and clearly.

“Infographics are becoming the new photographs for our time, they give a snapshot of information displayed in a simple to read picture”

Infographics are a type of visualization that allow people to quickly see what is really is going on.

Using infographics makes good sense, they make it easy to interpret information data, however they do come with some caveats.

Visualizing Infographics if not done right can be dangerous – “The emperors new clothes”

I have this niggling question about visualizing data infographics; how do you know what you’re seeing is telling the truth or am I just looking at a slick pretty picture?

Like the story of the Emperor’s new clothes being and thinking you got the greatest outfit but in reality you don’t have anything, infographics come with a similar challenge.

The pictures look really great but is there any validity to the data underneath? Go to Google images and search on infographics and you’ll get the eye candy experience.

It strikes me when I go to a number of websites with infographics they look really great, and that’s the problem, they look really great but is the information correct?

With the tools available in the marketplace on the PC desktop, the ability to be able to create great looking drawings, diagram and infographics is relatively easy, in other words, we can easily make “shiny objects”.

The challenge arises in that people are always attracted to the shiny object. They could be wooed by the look and feel of the infographic and not check the accuracy of the data and so it becomes the truth.

I came across a couple of articles that tell about a team of Belgian researchers that found that ’Human beings are attracted to glossy objects’.

‘However, the investigation of whether this preference for glossy is a systematic bias, and the rationale for why, has received little or no attention.’ ‘First and foremost, this paper shows that our preference for glossy might be deep-rooted and very human,’ say the authors.

Read more: hhttp://dailym.ai/1KOreTi  and http://bit.ly/1M7jbxW

Translate this into a Infographic and we run the danger…

If it looks great it must be correct!” (I Hope)

People will always be wooed by the shiny object, rather than digging in deeper to validate the quality of the message behind the picture.

The best ways to address this is by asking some questions:

  • Is the data set accurate?
  • Has the data been validated?
  • Does the infographic cite the source data and if so where can it be found?
Infographic Accuracy - Visualizing Techniques

The above image was created using a popular online tool for making Infographics. This is an example of ease of creating infographics.

Now the challenge is putting all the validation and crossing checking information into the Infographic. It’s probably going to spoil the look and feel. Maybe a shortlink may suffice.

Be warned, target audiences at presentations are usually well-educated and if they’re on the ball may ask, “how do I know this is telling me the truth?” If that’s the case, be well armed and have another “something” on hand to validate the pictures: a document, a reference guide, a handout or maybe a simpler infographic, to support the data.

If you’ve found a way to easily express the integrity of the data, then knock yourself out, go and create the greatest infographic to help get your message across.

That’s when a Visualization becomes a powerful tool in helping an audience understand a topic and possibly use that information to be better informed or make a better decision.

Image of Accurate Infographics for Visualization Techniques

Visualization techniques improve the way we build and support Technology Systems.

When we talk about visualizing data infographics, we’re showing a graphical multi-media or paper presentation to an audience of queried information extracted from a data warehouse.

When we talk about visualizations for building and maintaining technology systems, we’re talking about visualization techniques such as diagrams, drawings and presentations used in project management, business analysis, software development, testing, release management, and on-going support.

My research and observations show that not enough organisations use visualizations for this.

A general observation is there are lots of documents and, there are lots of individual diagrams inserted into those document, and there are lots of notations to support those diagrams.

If technology is going to elevate to new levels of innovation, development and growth, it will have to rely on the use Visualizations more effectively.

The power of using Visualization techniques such as diagramming for the development and support life cycle of technology is;

  • Saving in delivering systems through time and resources
  • Improving communication between project and support stakeholders
  • Providing traceability in development and support history

Imagine a 100 page document outlining the requirements of an Information Technology system. What would happen if that document only needed 20 pages of textual content and one diagram to explain what is being built? Imagine the saving.

“If a picture paints 1000 words then why are we still writing 1000 words to build and support Information Technology Systems?”

Image of an overview of a Data Visualization - Visualizing Techniques

My call today is for people and organisations to adopt an engineering approach to using more visualizations across the lifecycle of technology.

Technology practitioners need to adopt the zeal that the Data Visualization fraternity have when it comes to presenting their case through visualizing data infographics.

More visualizations help in creating an environment of innovation that improves the delivery of Information Technology Systems. The best architects and business analysts I have known all relied on using diagrams to maximise their efforts.

Organisations need to raise their capability maturity in this area.

In the last 400 years, human endeavour has been influenced greatly by the use of art, and drawings to capture what the eye sees and then allow people to build objects that influence how we live on this planet and leave this planet, in essence these are visualizations.

The secret is to use more diagrams, drawings and presentations in a way that an organisation can better deliver goods and services for its customers and itself now and into the future.

Visualising Information Technology

February 4, 2015 By Chris Mundy Leave a Comment

Image of Bagger-garzweiler mining equipment - By User:Martinroell [CC BY-SA 2.5 (http://creativecommons.org/licenses/by-sa/2.5)], via Wikimedia Commons

Bagger-garzweiler mining equipment 1

Hi and welcome to 2015, I want to share some thoughts and examples of technology visualisations and some background to visualising information technology but before I start I want to share a story.

In 1986 we moved to Queensland. We were young, just married and looking where to start on the adventure of a lifetime. At the time, I was an engineering draftsman with a background as a tradesman and had never really used the hands on experience of the trade as I had been promoted to the drawing office not long after completing my apprenticeship.

Within two weeks of arriving in Queensland, I won a job at a large mining engineering company as a machinist. My role was to take large blanks of metal and turn them into gears for mining equipment. The process took around two weeks.

In my two weeks of being on the job, I had to dig deep into gear and screw thread theory where I had to refresh my earlier trade training memory and skills on gear attributes such as:

  • Circular Pitch,
  • Face Width,
  • Pitch circle,
  • Addendum Circle,
  • Pitch Surface,
  • Bottom Land,
  • Chordal Pitch.

Image of Gear -  Visualising Information Technology

Figure 2 –  A Gear with terminology 2

Fortunately I had another Tradesman mentoring me and within three weeks we had created my first gear.

The thing that sticks out in my memory about creating gears, were the technology diagrams of the gear design. We had the product diagrams and we also used machinery’s handbook with it’s diagrams and tables of gear attributes.

These resources were instrumental in allowing me to understand how to  set up the machinery to create the gears.

Visualisations in Information Technology

Around 20 years later I moved into Enterprise Information Technology. I remember walking into a project and asking the question, “where are the drawings”?

It wasn’t long into the project that I found some concept drawings but nothing I could put my hands on to show what we were building.

Image of Network Operations

Figure 3 – Network Operations Room 3

I soon found out that Information Technology back then seemed to write a lot of documents with code than use diagrams to explain software development.

I set about undertaking my project management role for a team developing a software server and developing diagrams to explain to people what we were doing.

Working with the developers in the team, we went about creating some visualisations that assisted the team and other stakeholders to understand how our software server fitted in with the overall software architecture.

That was my first experience of using visualisations in Information Technology.

What is Visualising Information Technology?

The term visualisation is used a lot today in Information Technology circles, it is a term that’s growing in popularity.

You will find lots of terminology for visualisation from a number of sources around the web. The Macquarie Dictionary, starts with the verb (visualising); “to call up or form mental images or pictures or to make visual or visible”. Visualisation is the noun.

If we put technology together in the mix, it’s all about making technology visual or visible.

In its basic form, here’s the best description that I use and one I can easily relate to,

“Visualising Information Technology is a technique involving a visualisation to tell a technology story”.

Is it any different to a drawing, a diagram, a picture or an image used throughout history. Aren’t these visualisations?

Visualisations have been a scribble in the dirt, a drawing in a cave, a painted picture, a sketch. Closer to our history, it has been a diagram, a technical drawing, a map, a photograph or a video.

Visualisation is such a generic term and needs to kept that way, any point of categorising it to one discipline runs the danger of redefining the term to something that it isn’t.

Why Technology Visualisations?

For centuries, engineering has relied on the nut and bolt, in the common terms they’re called, fasteners. A nut and bolt allows two pieces of material to be joined or clamped together through a threaded hole in the nut with the external thread on the bolt.  A hole in both pieces of the material allows the bolt to pass through the material allowing the external thread to attach to the nut. When you screw the bolt into the nut, the two pieces are joined or clamped to together.

Image of an Internal External Screw Thread -  Visualising Information Technology

Figure 4 – An Internal External Screw Thread 4

The development of screw thread was most probably accelerated when people were able to draw images of the screw thread and apply logic to drawing such as:

  • Thread form,
  • Angle,
  • Pitch,
  • Lead, pitch, and starts,
  • Diameters,
  • Classes of Fits,
  • Thread Depth and Taper.


Can you imagine a couple of artisans in the Renaissance sharing each other’s designs, one from Switzerland saying, “we build our threads this way”, the other from Rome saying, “we do it this way”, then they draw it on a piece paper and figure out the differences.

Image of Leonardo da Vinci's Helicopter - Visualising Information Technology

Figure 5 – Leonardo da Vinci helicopter  5

The visualisation, in this case the drawing, became the vehicle that allowed them to check the differences and show the commonality.

For sometime I’ve been involved creating and helping people use visualisations to describe Information Technology. These amazing experiences and opportunities have helped people get on the “same page” for describing what technology was built and being built. It has help solve many problems.

Why Visualisations? They help people understand Information Technology easily and quickly.

Visualising Information Technology, Tangible or Intangible?

In general engineering when I created gears, I could touch them, I saw the original design drawings then after two weeks of machining I saw a blank piece of metal transformed into a gear you find in a gearbox or transmission. I could see the differential gears I created fitting together into the equipment.

When I moved into Information Technology, I was able to touch a screen, a keyboard, I could touch the paper of a print out, however, I couldn’t touch the code that performed the operations, the software code wasn’t tangible. I could visually see a field on a screen where you enter your name, but couldn’t touch a data set. I could see the output of an instruction, it appeared on a screen or on a print out.

I was starting to see for the first time that Information Technology and other related disciplines, have a high degree of intangible elements, you can’t touch them.

This raised the thought in my mind, how do I see intangible elements of Information Technology?

Visualising Information Technology provides clarity

It seemed to me, people needed to try to understand Information Technology in a way that made sense. A better way was needed.

My concerns were also the concerns of industry. At the time, the industry started moving to adopting and developing a number of notations such as Unified Modelling Language (UML) to help people understand software development and related disciplines.

Image of UML Diagrams - Visualising Information Technology

Figure 6 – UML Diagrams 6

People were coming to grips with using a notation like UML to describe software architecture, it was also what I was learning at University at the time.

It seemed that it was going to take some time to see the usage of visualisations such as diagrams and drawings gain maturity to aid in building and maintaining technology systems.

As I’ve moved further into different areas of information technology, I’ve found myself creating information technology visualisations such as diagrams, drawings and presentations. Here’s what I’ve found;

  • Visualising information technology helps me to describe technology systems. It focuses my thoughts and my thinking on what I perceive is the current or future state of a technology,
  • Visualisation help people understand more clearly what is there or what we want to move towards. That’s probably one of the best benefits. I’ve provided a picture, put it on the table and watched the conversation be totally focused on discussing whatever was on that paper,
  • Visualisations offer a level of authority. Correct or incorrect, visualisations provide a platform for challenging what’s on the paper. Ideas and thoughts are just that unless they are acted upon. One of the best ways of getting those ideas and thoughts together is to express them visually. If you’re the author, then as soon as you release a sketch, a picture, diagram or drawing they become the authority.

The clarity that a visualisation brings to Information Technology is powerful, it allows those intangible elements of technology to be described and understood.

From an audience of senior executives to developers, clarity helps people make better decisions in designing and delivering technology systems.

How will you start visualising Information Technology?

Some people say; “I find it hard to draw a picture, I can’t get my thoughts down on paper.” I can understand that.

I remember doing Art in high school and it was difficult trying to express my thoughts putting them into either a sketch, a pastel drawing or an oil painting.

When I took my Technical Drawing class, I found I needed a structure to help me put my thoughts together and express them on paper. Once I starting using the structure consistently it made it so much easier to produce a drawing.

So the first place to start is to have structure where you can learn how to visualise information technology.

The second place is to practice drawing those ideas and concepts. Start our sketching, draw some lines and boxes together and see how they come together in describing some technology.

The third is do a course that will teach you how to communicate information technology using visualisations such as diagrams and drawings. This is where I do some shameless self-promotion.

The Visualising IT Course 3 day course will help you

I’m teaching my course called Visualising IT, Information Technology.  Visualising IT is a 3-Day course where participants learn the theory and application related to creating and delivering visualisations such as diagrams, drawings and presentations. On day 3 participants have the opportunity to gain hands on experience creating visualisations and presentations in a scenario based role play.

Make sure you visit the Project Performance website where you can find out where to sign up for the Visualising IT course.

In the mean time, make sure you check out the collection of Technology Visualisations I’ve been collecting from the web to put you in the picture.

Keep your eye out on further articles on Visualising Information Technology on this blog.

Chris

PS. IT Visualisations Board on Pinterest

Click on this link to visit my board on IT Visualisations at Pinterest.

or you can also click on my name below to go directly to the Technology Visualisations, Diagrams, Drawings and Images Board.

I’m keeping a collection of interesting visualisations I find on the web.

Chris Mundy’s Pinterest Boards.


zW45v5t32w5c

  1. Figure – Bagger-garzweiler mining equipment – By User:Martinroell, CC BY-SA 2.5 (http://creativecommons.org/licenses/by-sa/2.5), via Wikimedia Commons. ↵
  2. Figure – Gear with terminology. http://en.wikipedia.org/wiki/Gear#mediaviewer/File:Gear_words.png  (Drawn by the uploading party.) GFDL (http://www.gnu.org/copyleft/fdl.html) or CC-BY-SA-3.0 (http://creativecommons.org/licenses/by-sa/3.0/), via Wikimedia Commons. ↵
  3. Figure – Operations Room By Gsmith 1 of 2 at en.wikipedia, Public domain, from Wikimedia Commons. ↵
  4. Figure – Image of an External and Internal Screw Thread By William Rafti of the William Rafti Institute CC BY 2.5, via Wikimedia Commons. ↵
  5. Figure  – Leonardo da Vinci helicopter by Leonardo da Vinci – ausschnitt aus, via Wikimedia Commons. ↵
  6. Figure  – UML Diagrams by Kishorekumar 62 – Own work. http://commons.wikimedia.org/wiki/File:UML_Diagrams.jpg#mediaviewer/File:UML_Diagrams.jpg Licensed under CC BY-SA 3.0, via Wikimedia Commons. ↵
  • Home
  • About
  • Topics
    • Audio Book Reviews
    • Business Tips
      • Change
      • Communications Overload
      • Managing Ideas
      • Time Management
      • Tips
      • Travel
    • Diagramming
    • Enterprise Architecture
      • Architecture
      • Design Standards
      • Enterprise IT
      • High-level Architecture
      • Mobile Devices
    • Life on the Net
      • File Transfers
      • RSS Feeds
      • Security
    • New Stuff
    • Personal Development
    • Productivity
    • Social Media
    • Technology
    • Tech Toys
    • Visualising Information Technology
    • Website Design
      • Channel Management
      • Commemorative Websites
      • Content Management System
    • Intranets
      • Intranet Design and Management
      • Intranet People Organisation
    • Usability
    • UX Design
    • Web Applications
    • WordPress
  • Contact Chris

Twitter Updates

Chris Mundy

chrismundy_me

  • chrismundy_me RT @BlueConic : .@realstorygroup 's Jarrod Gingras shares digital transformation tips for enterprise #marketing professionals looking to modi…

    4 years . reply . retweet . favorite

  • chrismundy_me Is Advertising In The Yellow Pages Worth It?https://t.co/H2egXIIetG

    4 years . reply . retweet . favorite

  • chrismundy_me Web Design vs. Graphic Design - Do you know who to engage the services of for your website? https://t.co/epjMxERYHd

    4 years . reply . retweet . favorite

  • chrismundy_me Website Auditing is Crucial for Business Success https://t.co/mQmD21MpaK

    4 years . reply . retweet . favorite

  • chrismundy_me The Importance of a Strong Online Presence https://t.co/i2yvDNpbPc

    4 years . reply . retweet . favorite

  • chrismundy_me I just passed the AgilePM® Foundation exam with @APMG_Inter -> https://t.co/bUkOud8zK4

    4 years . reply . retweet . favorite

  • chrismundy_me RT @AusHouseLondon : Yes - a great result! 👏 https://t.co/3fJnJj29YQ

    4 years . reply . retweet . favorite

join the conversation
By: Medical Jobs

Where else you can find me?

  • EC Perkins 4503 AIF
  • Motorcycle Riding Central
  • Visualising IT
  • Warwick Stuart
  • Your Web Presence

Copyright

All posts and comments © their original owners. Everything else is © Christopher Mundy. Chris' information can be reused or republished solely in accordance with the BY-NC-ND Creative Commons License. Please do the right thing.

Search

[footer_backtotop]

Copyright © 2023 Christopher Mundy · Website by YWP · Privacy Policy · Log in